

Multi-agent systems fail differently from single models. Errors cascade silently through chains of agent handoffs, tool calls, and memory operations until they surface as a broken user experience far downstream. AI agent observability is the discipline that lets your team see inside these chains while they run, trace failures to their root cause, and fix problems before they affect more users. This blog explains the core concepts, instrumentation strategies, and tooling choices your enterprise needs to make observability work in production.
Key Takeaways
|
What AI Agent Observability Means in Practice
AI agent observability goes beyond logging that a request was received and a response was returned. In an agentic system, the path between those two events may involve dozens of decisions: which tool to call, what memory to retrieve, how to interpret a tool response, and how to structure the next model prompt. Observability captures the full decision trace, not just the inputs and outputs at the pipeline boundary.
A complete observability record for an agent run captures the initial user input and resolved context, each tool call including its arguments and the tool’s response, each model prompt and the model’s raw output, every memory read and write operation, state transitions between agent steps, and branching decisions with the reason the agent chose each path.
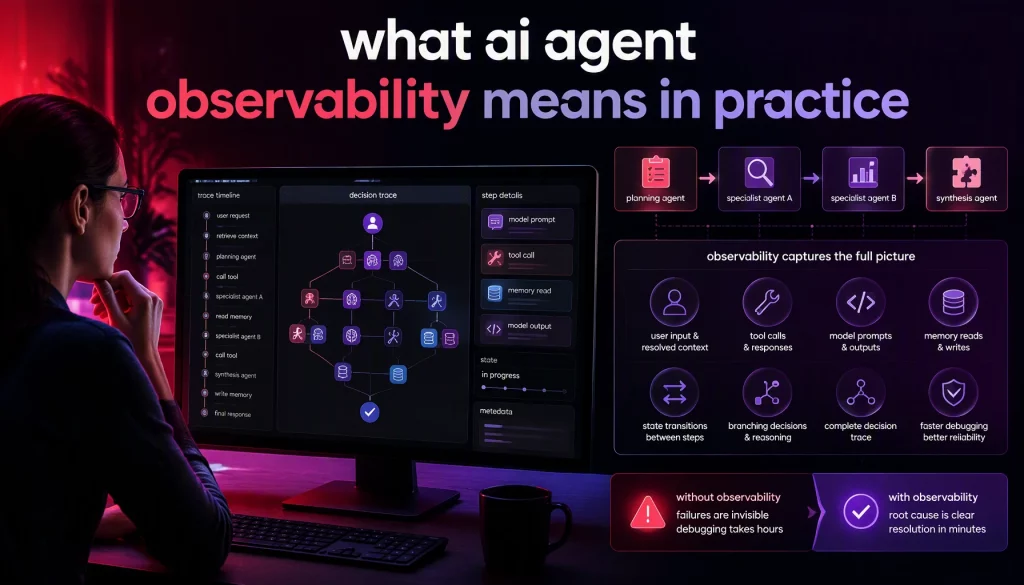
Consider a pipeline that routes a task through a planning agent, two specialist agents, and a synthesis agent. This four-step chain produces many individual decision points. Without hierarchical tracing, a failure in step two appears as a wrong final answer in step four, and debugging becomes guesswork. With proper observability, your team traces the failure directly to its origin in seconds rather than hours.
Why Multi-Agent Systems Demand Specialized Observability
Single-agent systems are relatively tractable to debug: one model, one tool set, one memory state. Investigating a single agent that produces a wrong answer typically means reviewing the prompt, inspecting the tool responses, and checking the model configuration. The observable state is manageable.
Multi-agent systems introduce failure modes that single-agent setups never face. Agents hand off tasks with partial context, and one agent’s hallucination becomes the next agent’s ground truth. A tool timeout at step two forces the orchestrator to retry with a different path, consuming additional tokens and producing non-deterministic results.
Multi-agent systems can also fail partially rather than completely. A pipeline might complete and return an answer while one sub-agent silently fell back to a cached result from 48 hours earlier. This partial failure is invisible to any monitoring system that only observes the final output. Step-level observability for every agent in the pipeline is the only reliable way to detect it.
As AI agent architecture patterns that support multi-agent systems mature, the observability layer has become a first-class architectural concern rather than an infrastructure add-on. Our team at AI Hive treats observability instrumentation as a non-negotiable requirement in every enterprise deployment architecture we design.
The 3 Layers of AI Agent Observability
Effective observability for multi-agent systems operates across three layers, and each layer captures signals the other two cannot expose on their own.
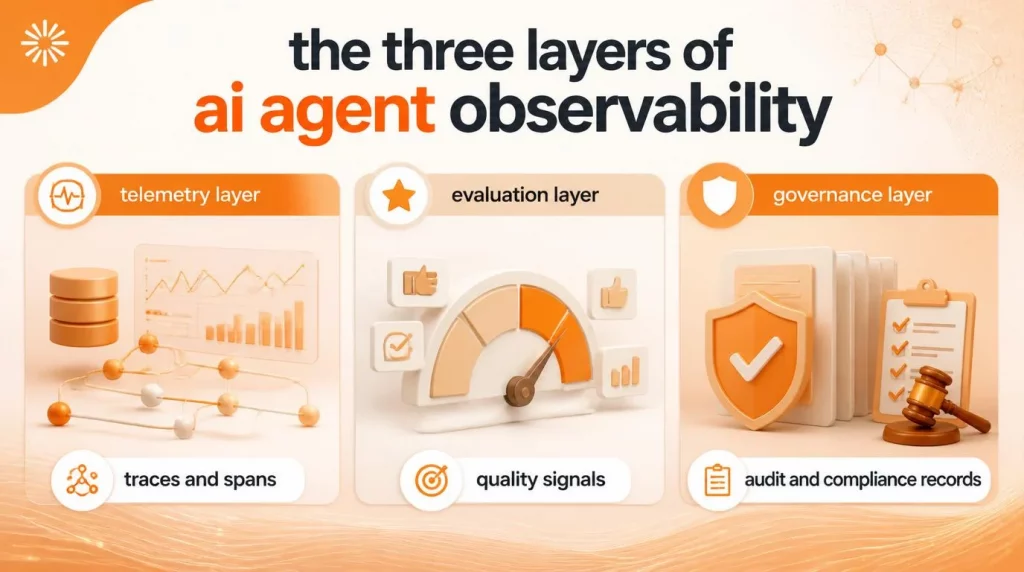
- Telemetry layer, traces and spans: Captures the raw event stream from your running agents. Each agent step emits a span, a structured record with a start time, end time, step type, inputs, outputs, and metadata. Spans link into traces representing the full execution of a single agent run. In 2026, OpenTelemetry with GenAI semantic conventions has become the emerging standard for agent telemetry, providing a vendor-neutral format that integrates with existing observability infrastructure.
- Evaluation layer, quality signals: Answers not what the agent did, but whether what it did was correct. Online evaluation attaches quality signals to traces in real time, checking whether tool arguments were valid, whether model outputs meet format requirements, and whether answers are factually consistent with retrieved context. Evaluation signals turn raw traces into actionable quality data, and the scoring methods behind them deserve their own scrutiny before you trust a green checkmark, which is exactly what our AI agent evaluation guide covers in depth.
- Governance layer, audit and compliance records: Ensures observability records also serve compliance and audit obligations. This layer keeps traces immutable, retained for the required duration, searchable for audit purposes, and capable of masking PII before logs are written to storage. It is also the layer that feeds the decisions made later in AI agent lifecycle management, since a clean audit trail is what tells you an agent is ready to retire rather than quietly drifting out of scope. Without the governance layer, your observability infrastructure may create compliance exposure even as it improves engineering visibility.
Distributed Tracing for Multi-Agent Pipelines
Distributed tracing is the foundational technique for observing multi-agent systems. Each agent step carries a trace ID and a parent span ID, so when step two calls step three, step three’s span nests under step two in the trace tree. The result is a hierarchical, reconstructable view of exactly what happened, in what order, and with what latency at each step.
Implementing distributed tracing in a multi-agent system requires that every agent, tool, and orchestration component participates in the same tracing context. A common failure mode is partial instrumentation, where the orchestrator is traced but individual specialist agents or external tool calls are not. The resulting trace has gaps that defeat the purpose of distributed observability.
Tracing context has to propagate through every inter-agent communication channel, whether that’s an API call, a message queue, a shared memory store, or a direct function call. We recommend defining your trace propagation standard at the architecture design stage, before implementation begins, so every component adheres to the same convention from the start rather than three teams inventing three formats.
Logging Strategy for AI Agent Systems
Logging in AI agent systems differs from traditional application logging in two important ways. First, the volume of useful log data runs substantially higher, because each model prompt, tool argument, and model output is a meaningful record rather than a debug annotation. Second, some of this data may contain user PII or proprietary business content, which means it needs careful handling before logs are written anywhere.
We recommend a structured logging strategy with three levels:
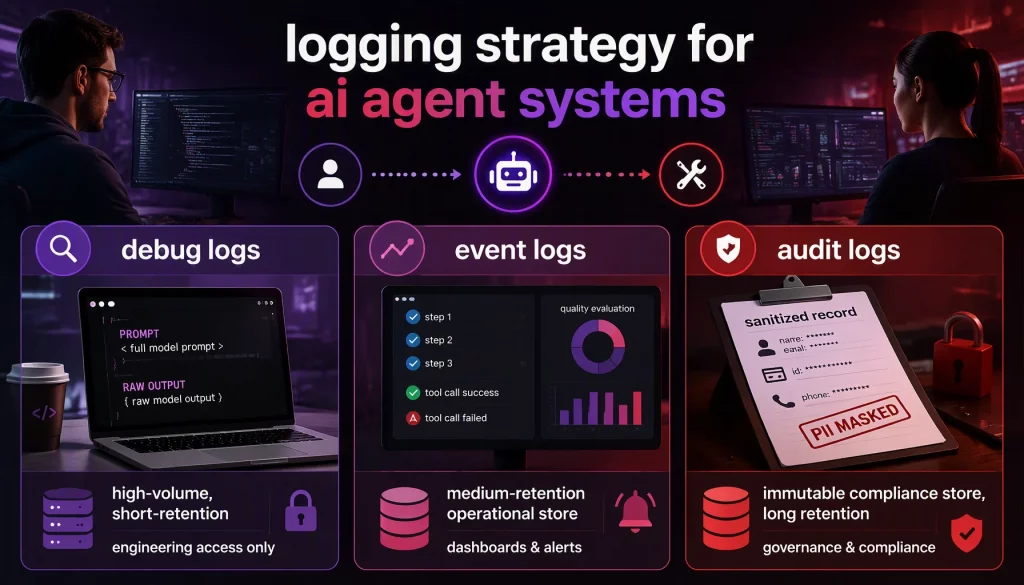
- Debug logs: Capture the full model prompt and raw model output for every step, stored in a high-volume, short-retention environment accessible only to the engineering team.
- Event logs: Capture step boundaries, tool call outcomes, and quality evaluation results in a medium-retention operational store used for dashboards and alerts.
- Audit logs: Capture sanitized records with PII masked according to your data classification policy, stored in an immutable compliance store with long retention.
Separating these three log levels lets engineering, operations, and compliance functions each access the data they need, without exposing sensitive debug information to compliance systems or flooding audit stores with high-volume telemetry.
Debugging Multi-Agent Failures in Production
When a production agent pipeline fails, the debugging workflow begins with the trace, not with the code. We recommend a structured diagnostic sequence that moves from observation to root cause as efficiently as possible.
Start by isolating the failing session in your trace dashboard using the session ID from the user complaint or alert. Review the trace tree to identify which span shows the first anomaly: a tool call that returned an error, a model output that failed quality evaluation, or a step that exceeded its latency budget. Once you identify the anomalous span, inspect its inputs. If the inputs to the failing step are already malformed, the root cause sits upstream, not in the step where the failure became visible, a pattern FutureAGI’s guide to tracing and debugging multi-agent systems documents in more technical depth.
This upstream propagation is the most common structure of multi-agent failures: a problem originates in step one, propagates through the handoff to step two, and becomes visible as a user-facing error in step three or four. In our experience deploying enterprise AI agents for clients in financial services, healthcare, and manufacturing, resolution time for production incidents drops by more than 60% once proper distributed tracing is in place.
Conclusion
AI agent observability is what transforms a multi-agent deployment from a black box into a manageable production system. The tracing, logging, and debugging strategies in this guide give your engineering teams the tools to understand what their agents are doing at every step, catch problems at their origin, and resolve incidents faster than any alternative approach allows.
Our team at AI Hive builds observability-first enterprise agent platforms, where tracing, quality evaluation, and governance logging are built into the architecture from day one, not retrofitted after launch. To learn how we approach observability for complex multi-agent deployments in your industry, reach out to the AI Hive team asap.