

AI agent monitoring is the practice of tracking task-level decision quality, tool-call outcomes, and cost per task for production AI agents, not just system uptime. AI agent monitoring is not the same as traditional application performance monitoring (APM): infrastructure can show green while the agent itself is completing tasks incorrectly.
When your AI agents move from pilot to enterprise AI agent deployment, monitoring becomes the difference between reliable ROI and costly silent failure. According to Gartner, 40% of organizations deploying AI plan to implement dedicated observability tools by 2028, yet fewer than 21% have governance models in place today.
This guide covers the specific metrics, dashboard structures, and alerting patterns your enterprise needs to operate AI agents with confidence at production scale.
Key Takeaways
|
Why Standard Application Monitoring Fails AI Agents?
Standard application monitoring fails AI agents because it measures whether a system responded, not whether it reasoned correctly. Traditional APM tools were built for deterministic software: a function receives an input and returns a predictable output. AI agents behave differently; they select tools dynamically, chain multiple model calls, maintain memory across turns, and branch based on probabilistic outputs.
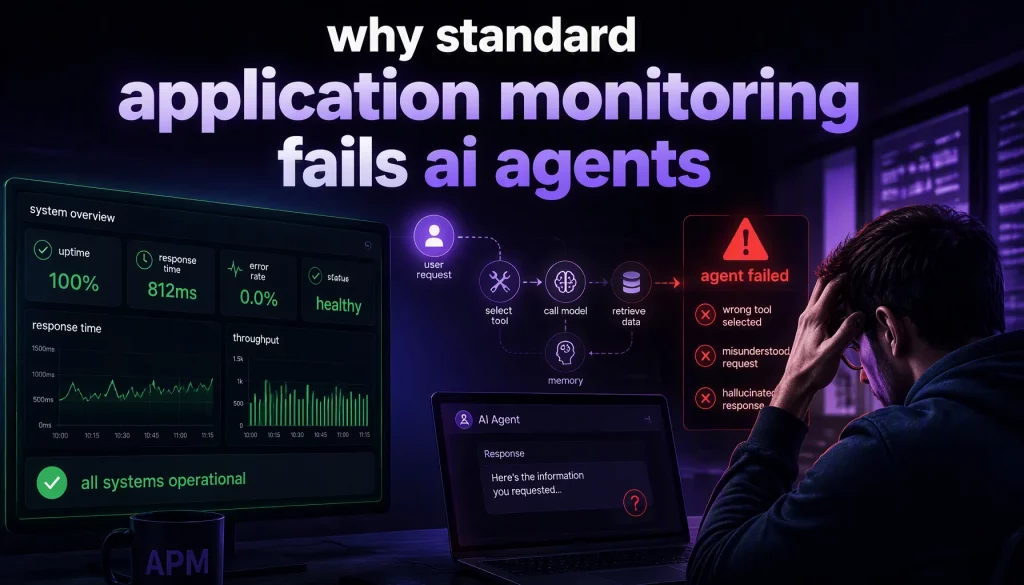
Consequently, production teams that apply conventional monitoring frameworks to AI agents quickly discover a dangerous gap: the infrastructure shows green while the agents are failing at the task level. An agent can return a response in 800 milliseconds with a 200 status code while completely misunderstanding the user’s request, calling the wrong tool, or returning a hallucinated answer.
This is why AI agent monitoring demands dedicated instrumentation that captures decision traces, tool call outcomes, and output quality signals, not just system health metrics. We have found that enterprise teams who attempt to retrofit traditional monitoring onto agentic systems typically discover the problem too late: in production, after users have already encountered failures.
💡 From the field: We once inherited a customer-support agent that looked perfectly healthy on the infrastructure dashboard sub-second latency, zero 5xx errors, 99.9% uptime while its actual task completion rate had quietly dropped to 61% after a routine model update changed its tool-selection behavior. Nobody noticed for eleven days because no one was tracking task-level outcomes, only system health. Instrumenting Task Completion Rate alongside infrastructure metrics is now the first thing we set up in any new deployment.
Core Metrics Every Production AI Agent Must Track
Effective AI agent monitoring requires tracking four distinct categories of metrics. Each category reveals a different failure surface that the others cannot expose.
| Metric | What It Measures | Our Recommendation |
| Task Completion Rate (TCR) | % of agent runs reaching a successful end state, per your business logic | Set a baseline in staging; alert on any drop exceeding 5% over a 24-hour window |
| Tool Call Success Rate | Whether each invoked tool returns a usable result | Monitor at the individual tool level, not session level, for faster root-cause identification |
| Output Quality Score | Accuracy and quality of agent output the hardest metric to automate | Combine rule-based checks with LLM-as-judge evaluators calibrated against human-labeled samples |
| Cost per Successful Task | Financial efficiency signal for finance and product teams | Investigate rising cost per task without quality gains usually prompt bloat or excess tool calls |
Gartner predicts that by 2028, explainable AI will drive LLM observability investments to 50% of GenAI deployments, reflecting how seriously enterprises are taking output quality at runtime.
Additional metrics to instrument from day one:
- P50/P90/P99 latency per agent step
- Token consumption by step and by session
- Hallucination rate flagged by your quality evaluator
- Memory read/write error rate
- User escalation rate in human-in-the-loop workflows
How to Structure Your AI Agent Monitoring Dashboard
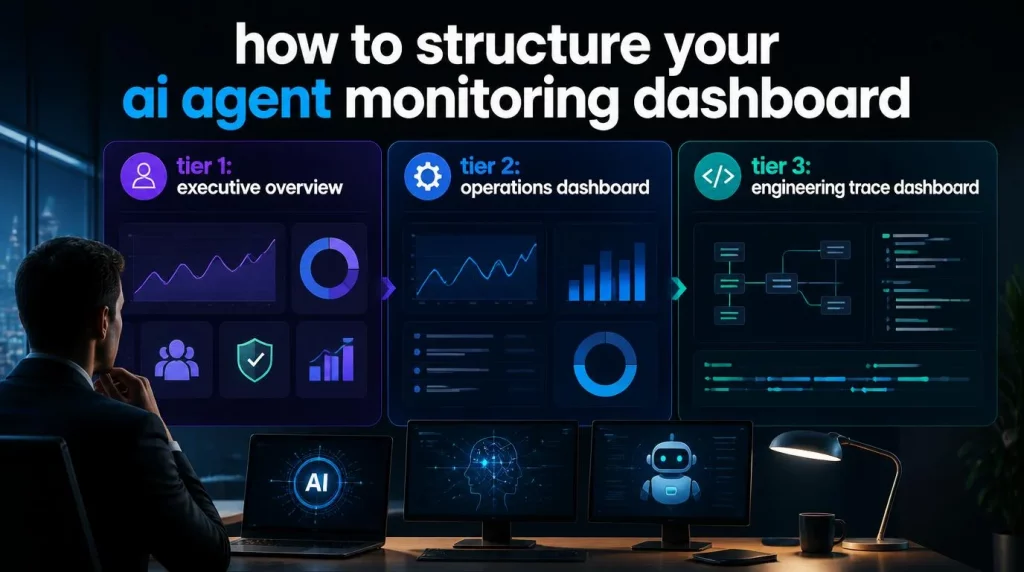
Structure your AI agent monitoring dashboard in three tiers, each serving a different audience, rather than building one dashboard that tries to serve engineering, operations, and finance simultaneously. A common mistake is conflating these audiences into a single view.
| Tier | Audience | What It Shows |
| Tier 1: Executive Overview | Non-technical stakeholders | Task completion rate, cost per successful task, error rate trend (7-day rolling), overall agent utilization |
| Tier 2: Operations Dashboard | Operations teams | Individual agent pipeline status, tool call success rates by tool, queue depth and processing latency, human-in-the-loop escalation volume |
| Tier 3: Engineering Trace Dashboard | Engineers | Full chain of tool calls, model inputs/outputs, step-by-step latency breakdown, memory state at each decision point |
The most important architectural principle is to separate your alerting mechanism from your dashboards. Dashboards are for investigation, not detection. Alerts detect; dashboards diagnose.
Alerting Patterns for AI Agent Systems
AI agent alerting needs three distinct pattern types, because agents can degrade gradually rather than failing catastrophically. Your alerting strategy must account for both sudden failures and slow degradation.
- Threshold Alerts: trigger when a metric crosses a fixed value agent pipeline down, API timeout rate above 10%, token budget exceeded. Implement these as your first layer of coverage, and page on-call engineers immediately.
- Anomaly Alerts: trigger when a metric deviates from its historical baseline, even without crossing a fixed threshold. Essential for catching gradual quality degradation, cost anomalies, and subtle behavior shifts. Requires at least two weeks of baseline data before producing reliable signals.
- Composite Alerts: combine two or more signals for example, task completion rate dropping while average session token count rises, which typically indicates the agent is looping. Composite alerts produce higher-confidence signals with fewer false positives than single-metric alerts.
In practice, your alerting runbook should define clear escalation paths for each alert type, specify the on-call rotation, and document the standard diagnostic steps engineers should follow. Documenting these paths before you experience a production incident is far less costly than improvising during one.
AI Agent Monitoring and Governance in Regulated Industries
In regulated industries, AI agent monitoring is not only a technical concern: the same instrumentation that detects performance degradation must also support compliance, audit, and governance obligations.
Your monitoring stack should produce immutable logs of every agent decision: the inputs the agent received, the tools it called, the model outputs it generated, and the final response it returned. These logs serve as the audit trail that compliance teams, regulators, and legal counsel will request when an agent produces an adverse outcome.
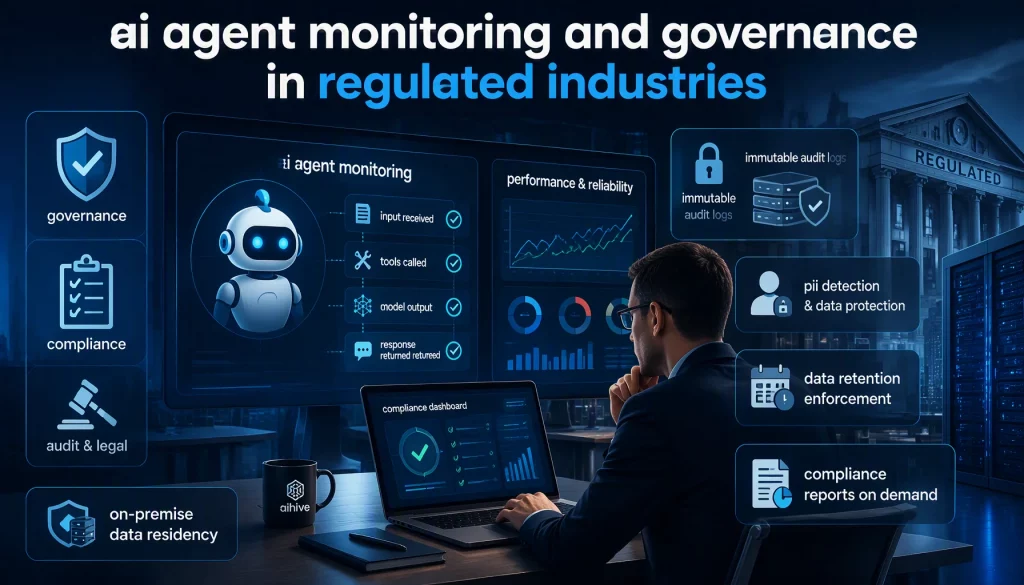
Furthermore, your monitoring system should flag personal information handled by agents, enforce data retention policies programmatically, and generate compliance reports on demand. For organizations that cannot let monitoring data leave their infrastructure perimeter, deploying on-premise AI monitoring is often the only architecture that satisfies data residency requirements.
Our team at AI Hive builds governance-aware monitoring into every enterprise AI agent deployment, ensuring that observability, compliance logging, and performance tracking operate from a single instrumentation layer rather than three separate integrations.
Common AI Agent Monitoring Mistakes to Avoid
Research from multiple 2026 enterprise surveys identifies five gaps that account for 89% of AI agent scaling failures, and inadequate monitoring tooling ranks third on that list. Three specific mistakes are repeated across enterprise deployments.
- Monitoring the infrastructure but not the agent logic: knowing that your Kubernetes pods are healthy and your API latency is within SLA does not tell you whether your agents are completing tasks correctly. Infrastructure monitoring and agent behavior monitoring must both be instrumented from day one.
- Relying on manual quality checks at scale: teams that launch agents without automated quality evaluation often staff up human reviewers to compensate. This approach is unsustainable and introduces its own consistency problems. Automated LLM-as-judge evaluation, calibrated against human baselines, is a necessary investment.
- Treating monitoring as a post-launch task: the cost of instrumenting monitoring after launch is significantly higher than building it in from the start, because it requires code changes to systems already serving users. We recommend instrumenting your monitoring stack during the staging phase, before production launch.
Conclusion
AI agent monitoring is not optional for enterprises that expect their agents to perform reliably at scale. The metrics, dashboard structures, and alerting patterns in this guide give your engineering and operations teams the visibility they need to catch degradation before it reaches users, control costs, and satisfy governance requirements.
Our team at AI Hive designs monitoring-first enterprise AI agent platforms that bring observability, compliance logging, and performance tracking together in a single cohesive layer. If your organization is preparing to scale AI agents from pilot to production, our enterprise AI agent development services team can assess your monitoring readiness and help you build a production-grade observability stack.
Connect with our team asap to get started by scheduling a brief meeting.